Extract information about non-parametric survival models
summaryKM.RdExtract information about non-parametric survival models
summaryKM(
  data,
  time_var,
  event_var,
  weight_var = "",
  strata_var,
  int_name,
  ref_name,
  types = c("survival", "cumhaz", "median", "rmst"),
  t = NULL,
  ci = FALSE,
  se = FALSE,
  ...
)
Arguments
- data
A data frame containing individual patient data for the relevant time to event outcomes.
- time_var
Name of time variable in 'data'. Variable must be numerical and >0.
- event_var
Name of event variable in 'data'. Variable must be numerical and contain 1's to indicate an event and 0 to indicate a censor.
- weight_var
Optional name of a variable in "data" containing case weights.
- strata_var
Name of stratification variable in "data". This is usually the treatment variable and must be categorical. Not required if only one arm is being analyzed.
- int_name
Character to indicate the name of the treatment of interest, must be a level of the "strata_var" column in "data", used for labelling the parameters.
- ref_name
Character to indicate the name of the reference treatment, must be a level of the "strata_var" column in "data", used for labelling the parameters. Not required if only one arm is being analyzed.
- types
A list of statistics to extract - options include "survival", "cumhaz", "median", and "rmst". For details see the vignette on descriptive analysis.
- t
The time points to be used - this only controls the rmst statistic.
- ci
Should a confidence interval be returned (TRUE or FALSE)
- se
Should a standard error be returned (TRUE or FALSE)
- ...
Additional arguments passed to
survfit
Value
A data frame containing the following values and similar to that returned by summaryPSM
Model - returned as "Kaplan Meier"
ModelF - an ordered factor of Model
Dist - returned as "Kaplan Meier"
DistF - an ordered factor of Dist
distr - returned as "km"
Strata - Either Intervention or Reference
StrataName - As specified by int_name and ref_name respectively.
type - as defined by the types parameter.
variable - "est", "lcl", "ucl", "se" respectively
time - either NA or the time the statistic is evaluated at
value - estimated value
Examples
require(dplyr)
require(ggplot2)
#> Loading required package: ggplot2
PFS_data <- sim_adtte(seed = 2020, rho = 0.6) %>%
filter(PARAMCD=="PFS") %>%
transmute(USUBJID,
ARMCD,
PFS_days = AVAL,
PFS_event = 1- CNSR,
wt = runif(500,0,1)
)
pfs_info <- summaryKM(
data = PFS_data,
time_var = "PFS_days",
event_var = "PFS_event",
strata_var = "ARMCD",
int_name = "A",
ref_name = "B",
ci = TRUE,
t = c(500, 700))
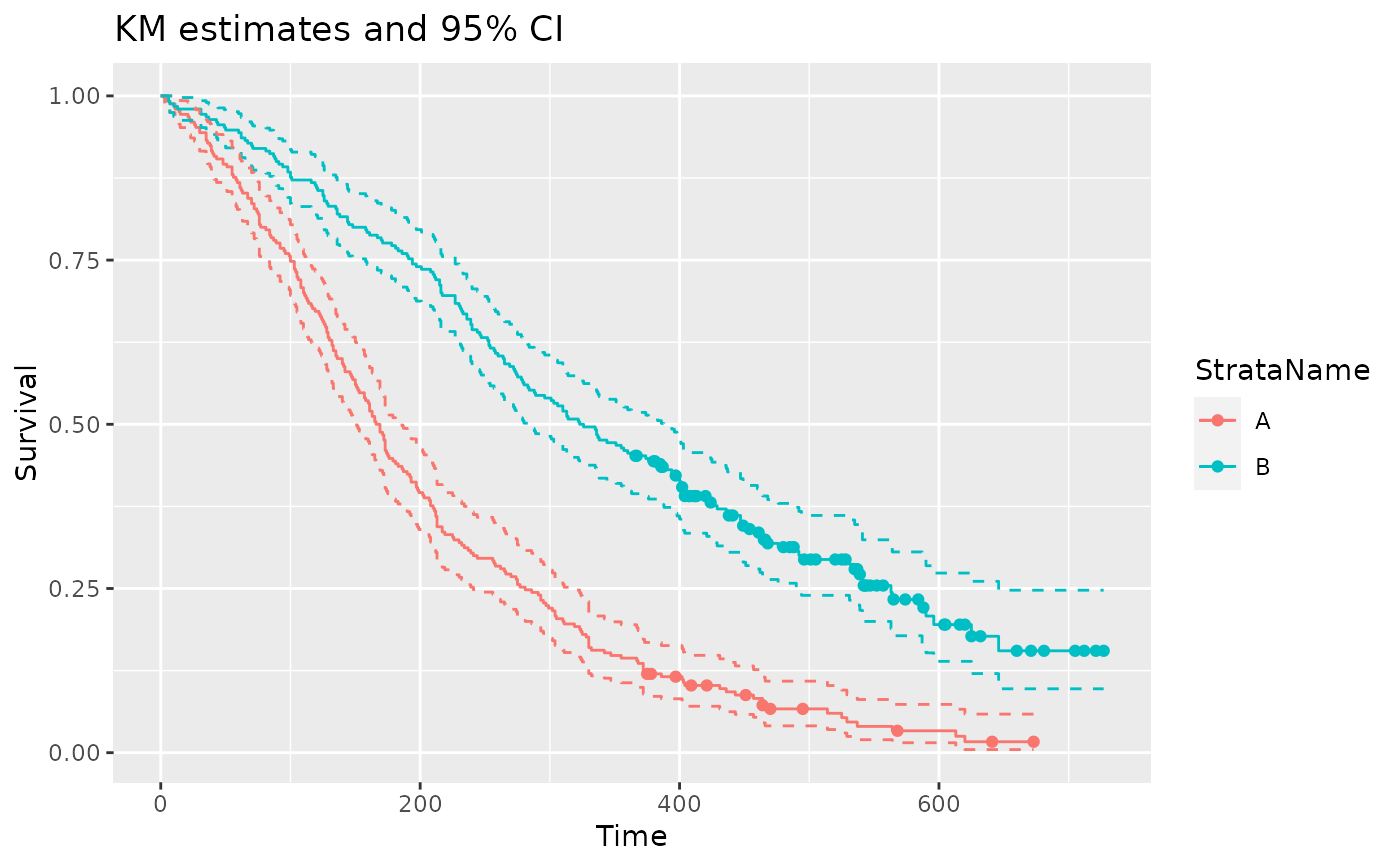
ggplot(data = filter(pfs_info, type == "survival", variable == "est"),
aes(x = time, y = value, color = StrataName)) +
geom_step() +
geom_step(data = filter(pfs_info, type == "survival", variable == "lcl"), linetype = 2) +
geom_step(data = filter(pfs_info, type == "survival", variable == "ucl"), linetype = 2) +
geom_point(data = filter(pfs_info, type == "survival", variable == "censored")) +
xlab("Time") +
ylab("Survival") +
ggtitle("KM estimates and 95% CI")
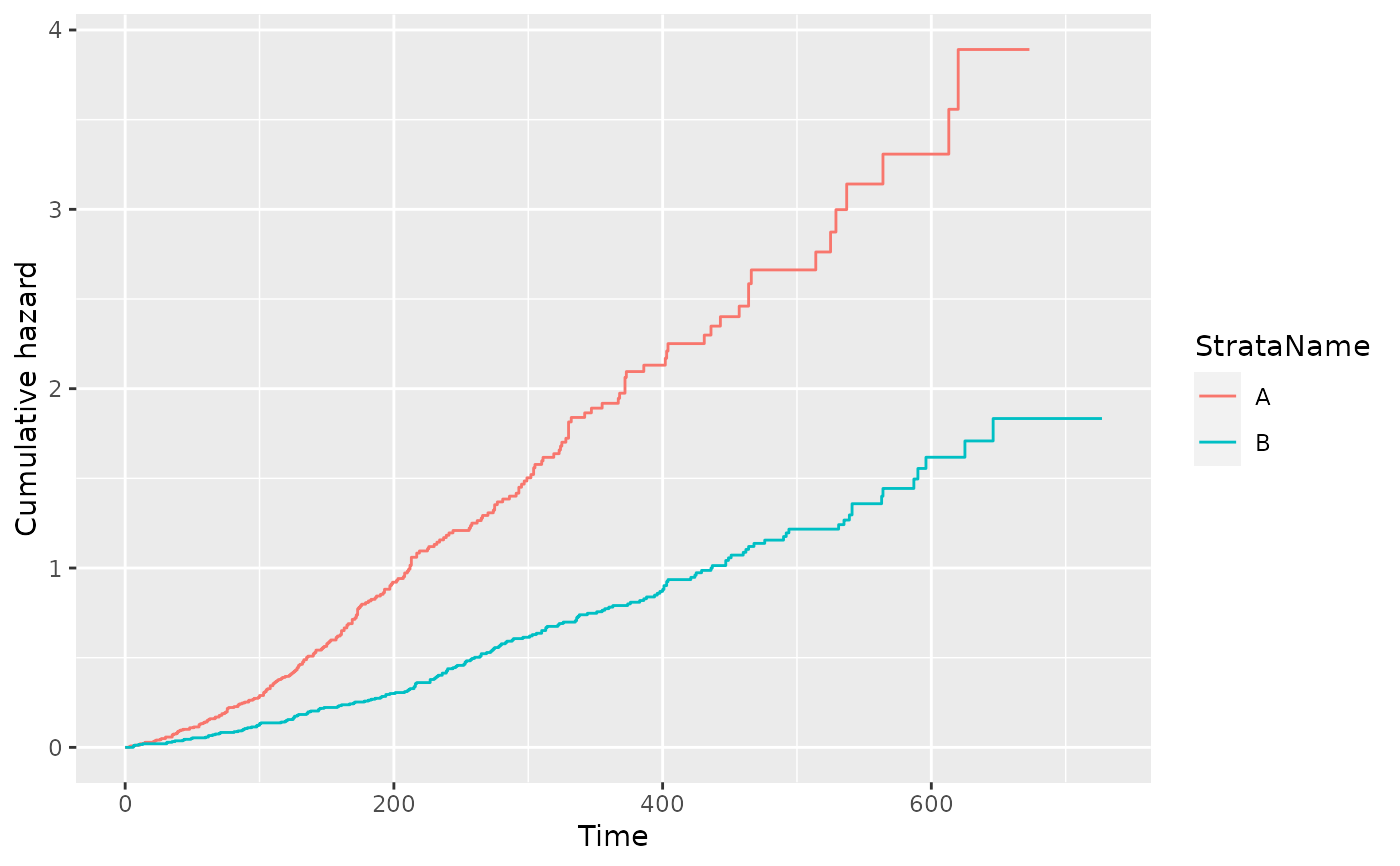
 filter(pfs_info, type == "cumhaz", variable == "est") %>%
ggplot(aes(x = time, y = value, color = StrataName)) +
geom_step() +
xlab("Time") +
ylab("Cumulative hazard")
filter(pfs_info, type == "cumhaz", variable == "est") %>%
ggplot(aes(x = time, y = value, color = StrataName)) +
geom_step() +
xlab("Time") +
ylab("Cumulative hazard")
 filter(pfs_info, type == "median") %>%
transmute(StrataName, variable, value)
#> # A tibble: 6 × 3
#> StrataName variable value
#> <chr> <chr> <dbl>
#> 1 A est 168.
#> 2 A lcl 151
#> 3 A ucl 186
#> 4 B est 324.
#> 5 B lcl 283
#> 6 B ucl 388
filter(pfs_info, type == "rmst") %>%
transmute(StrataName, variable, time, value)
#> # A tibble: 4 × 4
#> StrataName variable time value
#> <chr> <chr> <dbl> <dbl>
#> 1 A est 500 199.
#> 2 A est 700 NA
#> 3 B est 500 321.
#> 4 B est 700 364.
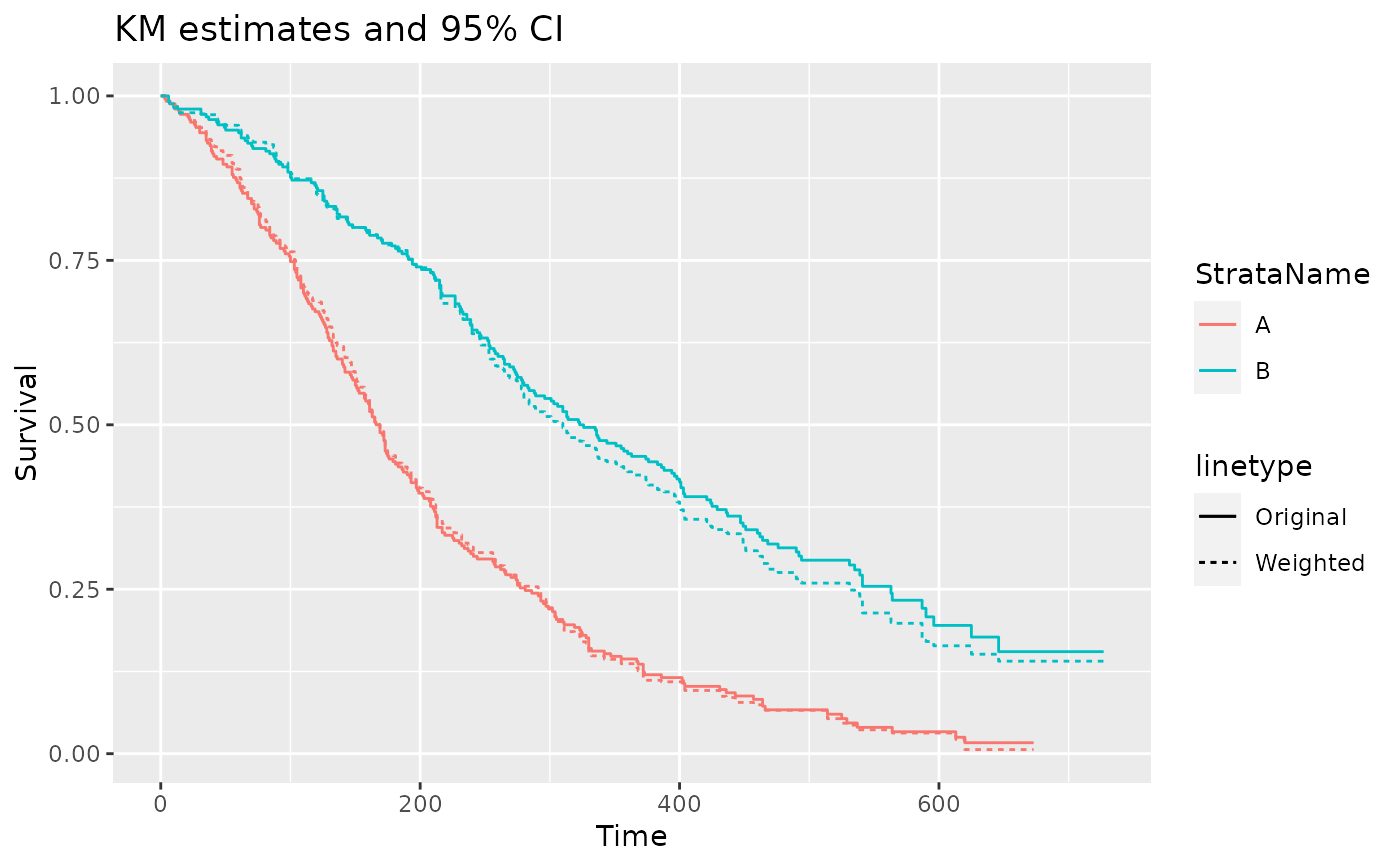
# example with weights
pfs_info_wt <- summaryKM(
data = PFS_data,
time_var = "PFS_days",
event_var = "PFS_event",
strata_var = "ARMCD",
weight_var = "wt",
int_name = "A",
ref_name = "B",
types = "survival"
)
ggplot(data = filter(pfs_info, type == "survival", variable == "est"),
aes(x = time, y = value, color = StrataName)) +
geom_step(aes(linetype = "Original")) +
geom_step(data = filter(pfs_info_wt, type == "survival", variable == "est"),
aes(linetype = "Weighted")) +
xlab("Time") +
ylab("Survival") +
ggtitle("KM estimates and 95% CI")
filter(pfs_info, type == "median") %>%
transmute(StrataName, variable, value)
#> # A tibble: 6 × 3
#> StrataName variable value
#> <chr> <chr> <dbl>
#> 1 A est 168.
#> 2 A lcl 151
#> 3 A ucl 186
#> 4 B est 324.
#> 5 B lcl 283
#> 6 B ucl 388
filter(pfs_info, type == "rmst") %>%
transmute(StrataName, variable, time, value)
#> # A tibble: 4 × 4
#> StrataName variable time value
#> <chr> <chr> <dbl> <dbl>
#> 1 A est 500 199.
#> 2 A est 700 NA
#> 3 B est 500 321.
#> 4 B est 700 364.
# example with weights
pfs_info_wt <- summaryKM(
data = PFS_data,
time_var = "PFS_days",
event_var = "PFS_event",
strata_var = "ARMCD",
weight_var = "wt",
int_name = "A",
ref_name = "B",
types = "survival"
)
ggplot(data = filter(pfs_info, type == "survival", variable == "est"),
aes(x = time, y = value, color = StrataName)) +
geom_step(aes(linetype = "Original")) +
geom_step(data = filter(pfs_info_wt, type == "survival", variable == "est"),
aes(linetype = "Weighted")) +
xlab("Time") +
ylab("Survival") +
ggtitle("KM estimates and 95% CI")